
Ethereum price rebounded from $1,850 to trade above $1,900 on Aug. 12 as softer U.S. inflation data supported risk appetite and buyers returned near a key support zone.
Summary
- Ethereum price rose about 3% from $1,850, reaching an intraday high near $1,918.
- ETH reclaimed its 20-day and 100-day moving averages, strengthening the short-term recovery.
- 4-hour resistance sits at $1,925, followed by a large liquidation cluster around $1,950.
- Losing $1,887–$1,890 could expose $1,850 and weaken the latest bullish setup.
Ethereum price action today
According to data from crypto.news, Ethereum (ETH) price traded near $1,916 at the time of writing after moving between an intraday low of $1,880 and a high of $1,918, according to the Binance daily chart.
Buyers stepped in after ETH briefly revisited the $1,850 region on Aug. 11. The rebound carried the token back through $1,900, a level that had repeatedly limited recovery attempts during the previous week.
Cooling U.S. inflation data added support to the move by improving demand for risk assets. A softer Consumer Price Index reading can strengthen expectations for easier Federal Reserve policy, although the timing of any rate change remains dependent on incoming economic data and Fed guidance.
Price has now returned to the upper end of its recent consolidation range. A confirmed breakout remains absent because ETH has yet to close decisively above the resistance band stretching from $1,925 to $1,950.
CPI and spot demand support the ETH rebound
The U.S. Bureau of Labor Statistics will release its July CPI report at 8:30 a.m. ET on Aug. 12. The data could influence Federal Reserve rate expectations and Ethereum’s next move. Softer inflation conditions generally tend to reduce pressure on the Fed to keep monetary policy restrictive, supporting assets such as Ethereum that are sensitive to changes in liquidity expectations.
Spot buying also strengthened as ETH recovered. The move followed a period of accumulation in which large holders reportedly withdrew 30,000 ETH from centralized exchanges. Exchange withdrawals can reduce immediately available supply, though they do not establish whether holders intend to retain or later sell those tokens.
Reported trading volume during the breakout rose 35% above its 20-day average. Stronger volume gave the move more support than earlier attempts to clear $1,900, but follow-through above $1,925 is still needed.
Ethereum price must clear $1,925 and $1,950
The daily chart shows ETH trading above its 20-day simple moving average at $1,894 and its 100-day average near $1,891. Both indicators now form an immediate support area around $1,890.
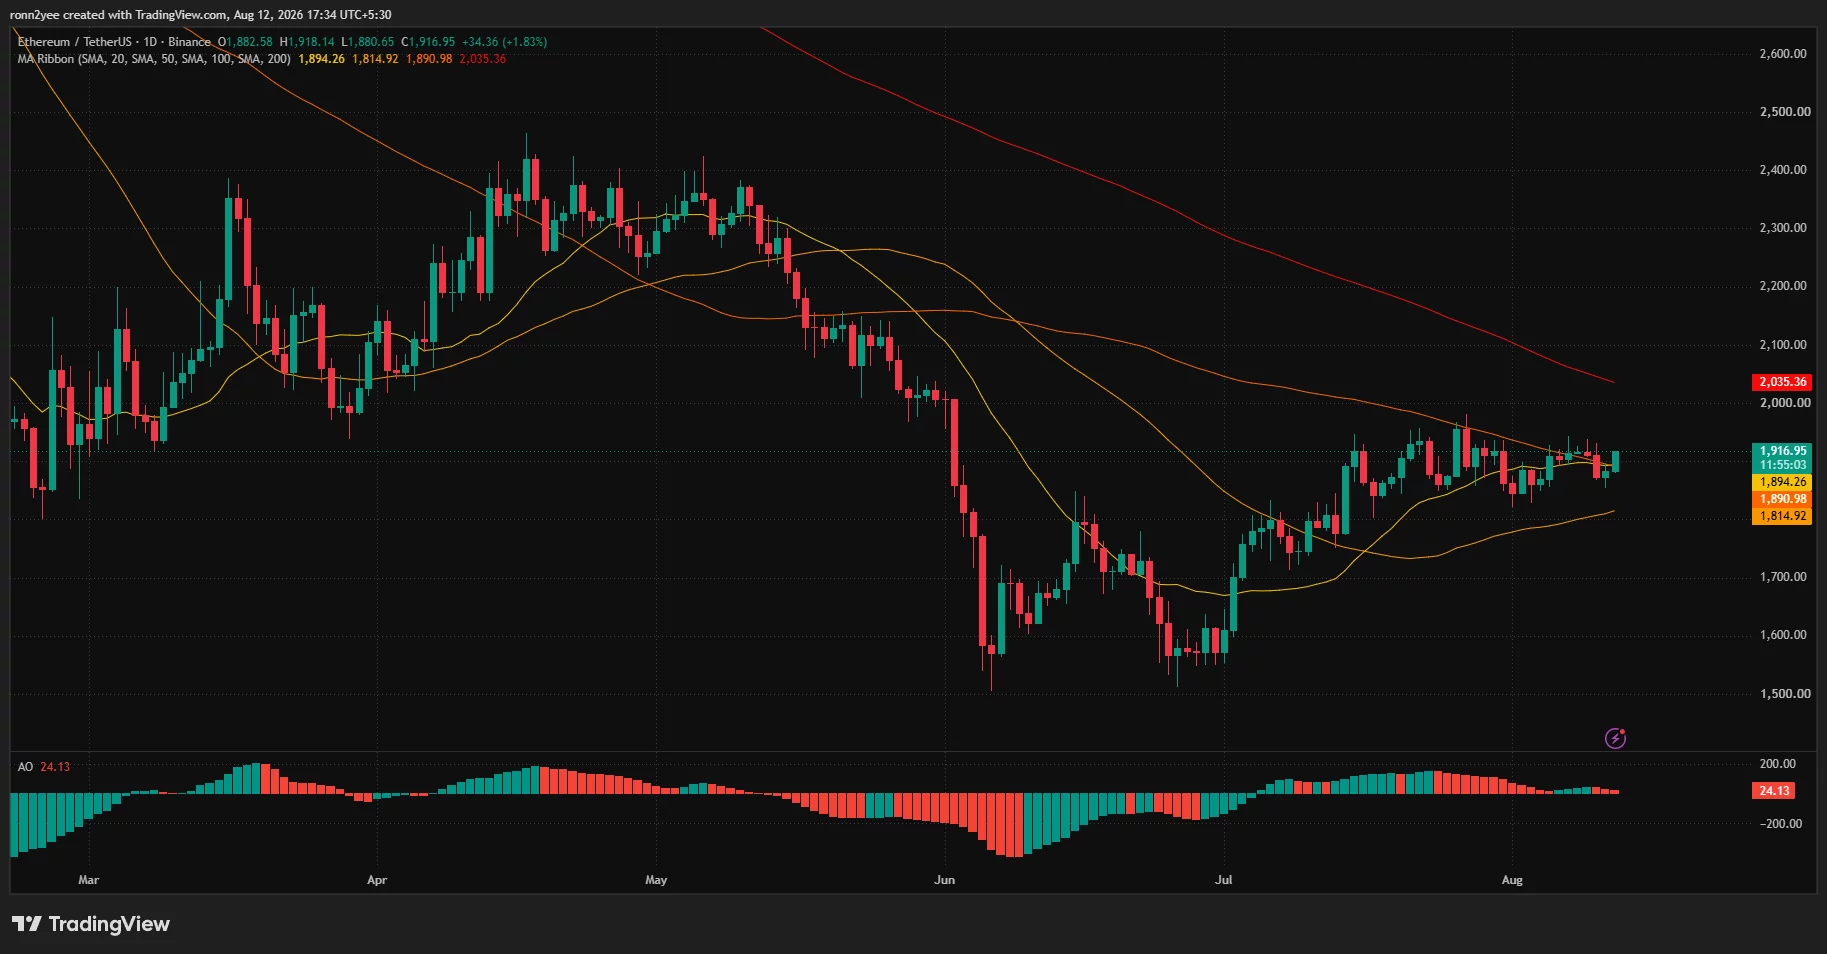
Ethereum also remains above the 50-day average at $1,815, confirming that the recovery from June’s low near $1,520 has not broken down. However, the token still trades below its declining 200-day average at $2,035, leaving the broader trend under pressure.
The Awesome Oscillator remains positive at 24.13, showing that bullish momentum has not disappeared. Recent histogram bars have contracted; however, indicating that momentum needs to expand again for ETH to sustain a breakout.
4-hour indicators provide a similar picture. The Supertrend remains bearish with resistance at $1,925.49, while its lower reference level near $1,887.64 marks the first support.
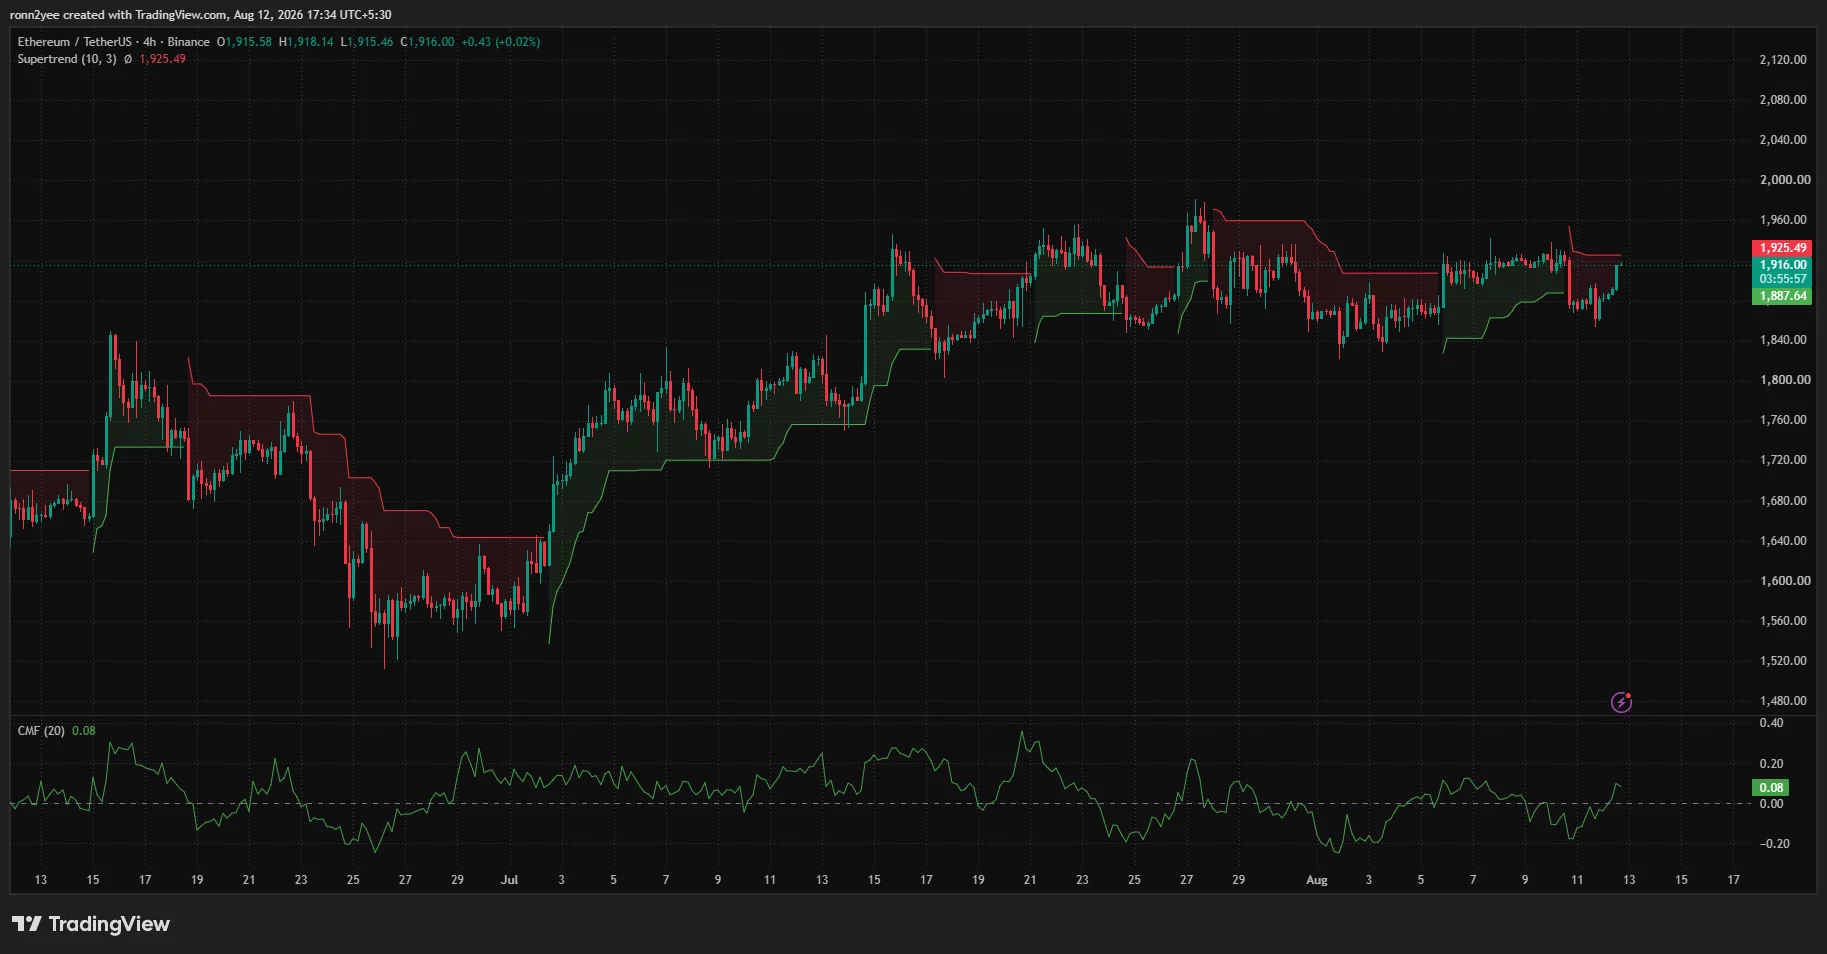
Chaikin Money Flow has risen to 0.08, showing modest net buying pressure. A move deeper into positive territory alongside a close above the Supertrend would provide stronger confirmation that buyers control the short-term trend.
Liquidation heatmap points to $1,950
CoinGlass’ one-week liquidation heatmap shows the largest nearby concentration of leveraged positions around $1,950. Price often moves toward areas containing dense liquidity, making the zone a likely target if ETH clears $1,925.
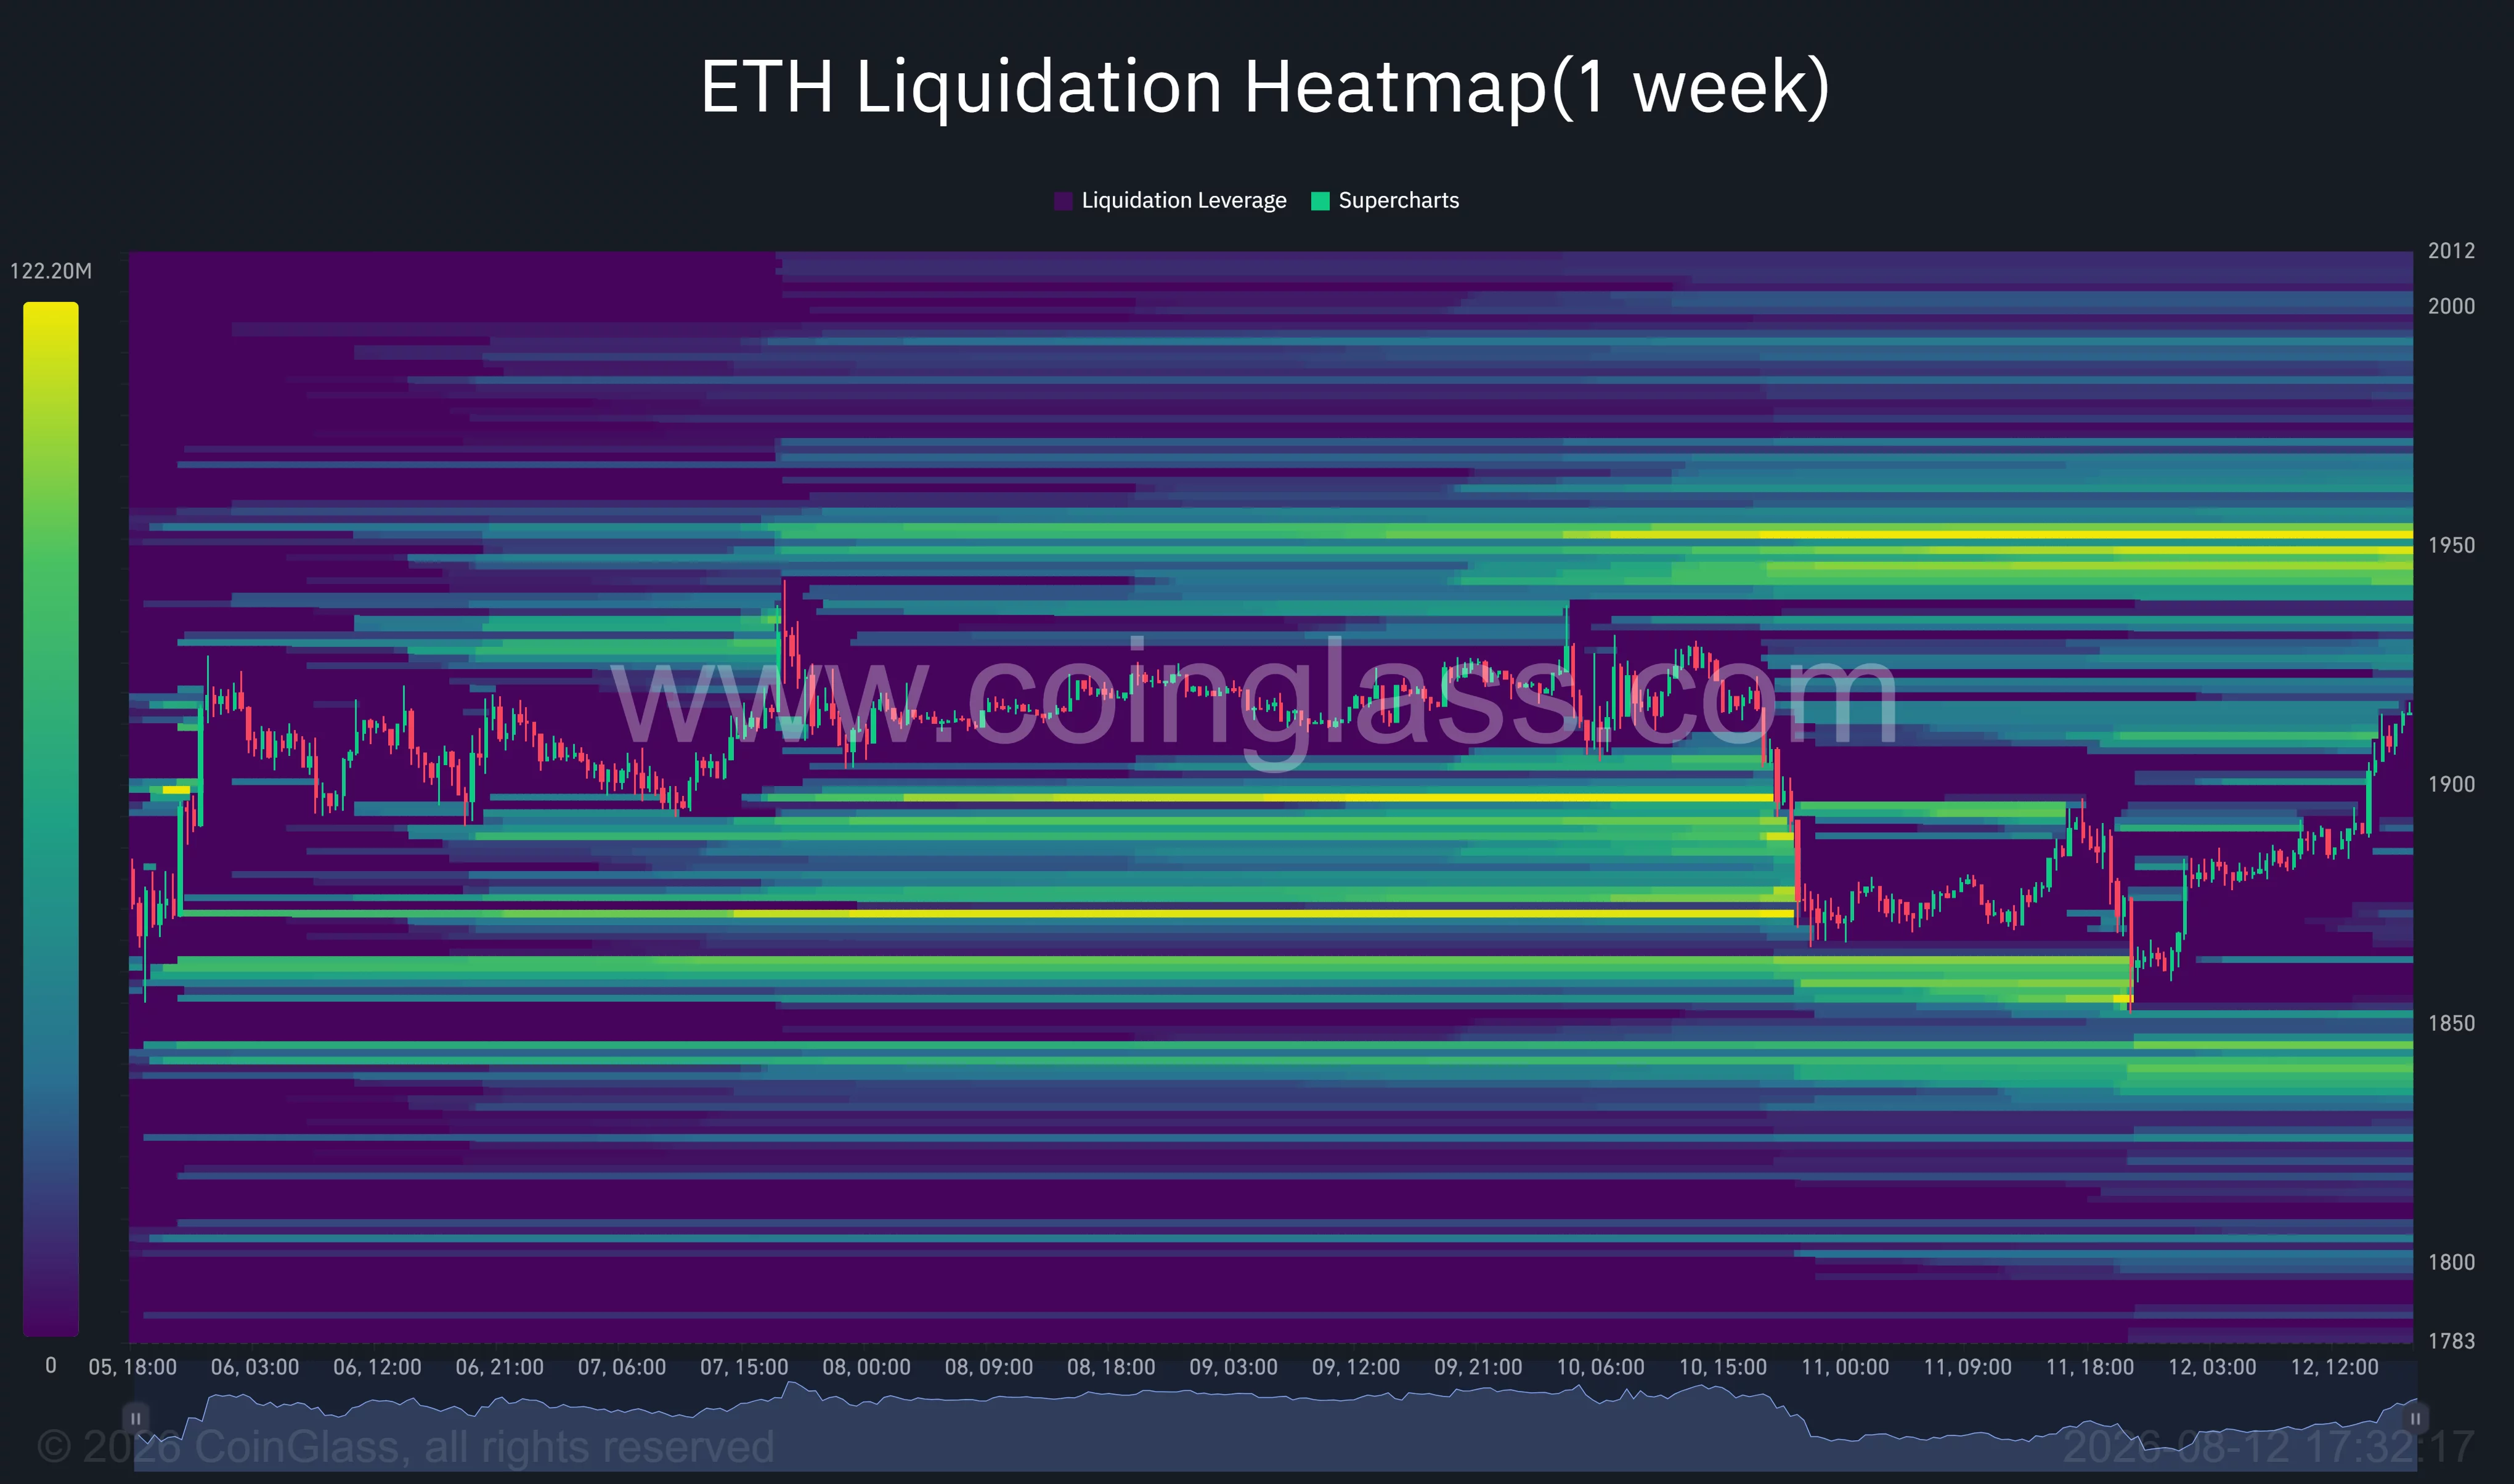
A breakthrough at $1,950 could force additional short liquidations and accelerate a move toward $2,000. The daily 200-day moving average near $2,035 would become the next major technical test above the psychological threshold.
Liquidity also remains concentrated below the market around $1,890, $1,850, and $1,840. A rejection from $1,925–$1,950 followed by a loss of $1,887 could pull ETH back toward those downside clusters.
Support at $1,850 remains the main short-term invalidation level. A daily close below it would expose the 50-day moving average near $1,815, while deeper weakness could reopen the path toward $1,700.
Analysts target $2,000 before a larger breakout
Crypto analyst Ted Pillows said Ethereum had bounced from $1,850 but needed to reclaim the $1,900–$1,920 range before extending toward $2,000.
“Now, Ethereum needs to reclaim the $1,900–$1,920 level for a pump towards $2,000.”
ETH has entered the analyst’s breakout range, although it must still hold above the area on a closing basis.
Michaël van de Poppe described Ethereum’s consolidation as a series of higher lows accompanied by low volatility. He identified $2,300 as his first target zone if ETH price breaks out with strength.
“Volatility is low, range is tight, meaning that the breakout will be super volatile.”
The immediate chart offers a more conservative sequence. Bulls first need to secure $1,925, clear the $1,950 liquidation cluster, and reclaim $2,000 before $2,300 becomes technically relevant.
Failure to hold $1,890 would shift attention back to $1,850. For now, Ethereum’s recovery remains intact, but the next directional move depends on whether spot demand can convert the CPI-driven rebound into a confirmed breakout.
Disclosure: This article does not represent investment advice. The content and materials featured on this page are for educational purposes only.
